Introduction of company
The world of new finance, indirect investment! At the center of that investment is the Golden Bridge.
Introduction of company
The world of new finance, indirect investment! At the center of that investment is the Golden Bridge.
Your success starts when you meet Golden Bridge.
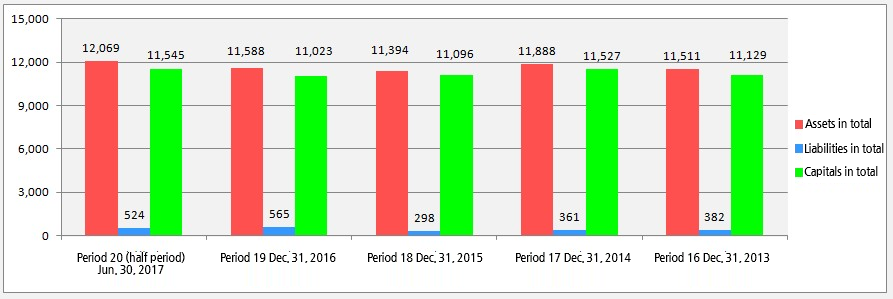
(Unit: million Won)
| Accounts | Period 20(half)2017.06.30 | Period 192016.12.31 | Period 182015.12.31 | Period 172014.12.31 | Period 162013.12.31 | |
|---|---|---|---|---|---|---|
| Assets | Cash and deposits | 6,124 | 5,800 | 4,509 | 6,429 | 5,018 |
| Financial assets recognized of current profit or loss | 513 | 965 | 1,200 | 911 | 13 | |
| Available for sale | 2,393 | 2,066 | 2,098 | 1,844 | 894 | |
| Investment in related companies | - | - | - | - | 900 | |
| Loans assets | 1,092 | 595 | 1,142 | 497 | 995 | |
| Tangible assets | 44 | 35 | 4 | 3 | 2 | |
| Other assets | 1,903 | 2,127 | 2,441 | 2,204 | 3,689 | |
| Assets in total | 12,069 | 11,588 | 11,394 | 11,888 | 11,511 | |
| Liabilities | Deposits received | 33 | 88 | 95 | 57 | 6 |
| Other liabilities | 491 | 477 | 203 | 304 | 376 | |
| Liabilities in total | 524 | 565 | 298 | 361 | 382 | |
| Capital | Capital | 10,000 | 10,000 | 10,000 | 10,000 | 10,000 |
| Capital adjustment | - | - | - | - | ||
| Other comprehensive profit or loss | 180 | 66 | 91 | 49 | 42 | |
| Retained earnings | 1,365 | 957 | 1,005 | 1,478 | 1,087 | |
| Capital in total | 11,545 | 11,023 | 11,096 | 11,527 | 11,129 | |
| Liabilities and capitals in total | 12,069 | 11,588 | 11,394 | 11,888 | 11,511 |
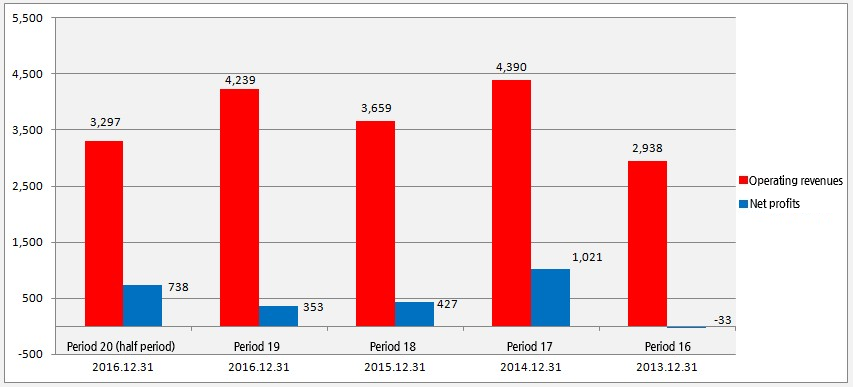
(Unit: million Won)
| Account | Period 20(half)2017.06.30 | Period 192016.12.31 | Period 182015.12.31 | Period 172014.12.31 | Period 162013.12.31 |
|---|---|---|---|---|---|
| Operating revenues | 3,297 | 4,239 | 3,659 | 4,390 | 2,938 |
| Operating expenses | 2,313 | 3,841 | 3,106 | 2,775 | 2,092 |
| Operating profits | 984 | 398 | 553 | 1,615 | 846 |
| Non-operating revenues | -60 | 41 | -17 | -318 | -763 |
| Profit before corporate taxes | 924 | 439 | 536 | 1,297 | 83 |
| Tax expenses | 186 | 86 | 109 | 276 | 117 |
| Net profits | 738 | 353 | 427 | 1,021 | -33 |